Waterfowl Breeding Population and Habitat Survey
The Waterfowl Breeding Population and Habitat Survey (May Survey) is an aerial survey conducted in the U.S. and Canada and it provides annual breeding population estimates for most duck species in North America.
The May Survey also provides:
- An assessment of breeding habitat conditions
- Triggering levels for harvest regulations through Adaptive Harvest Management
- Information to assess objectives within the North American Waterfowl Management Plan
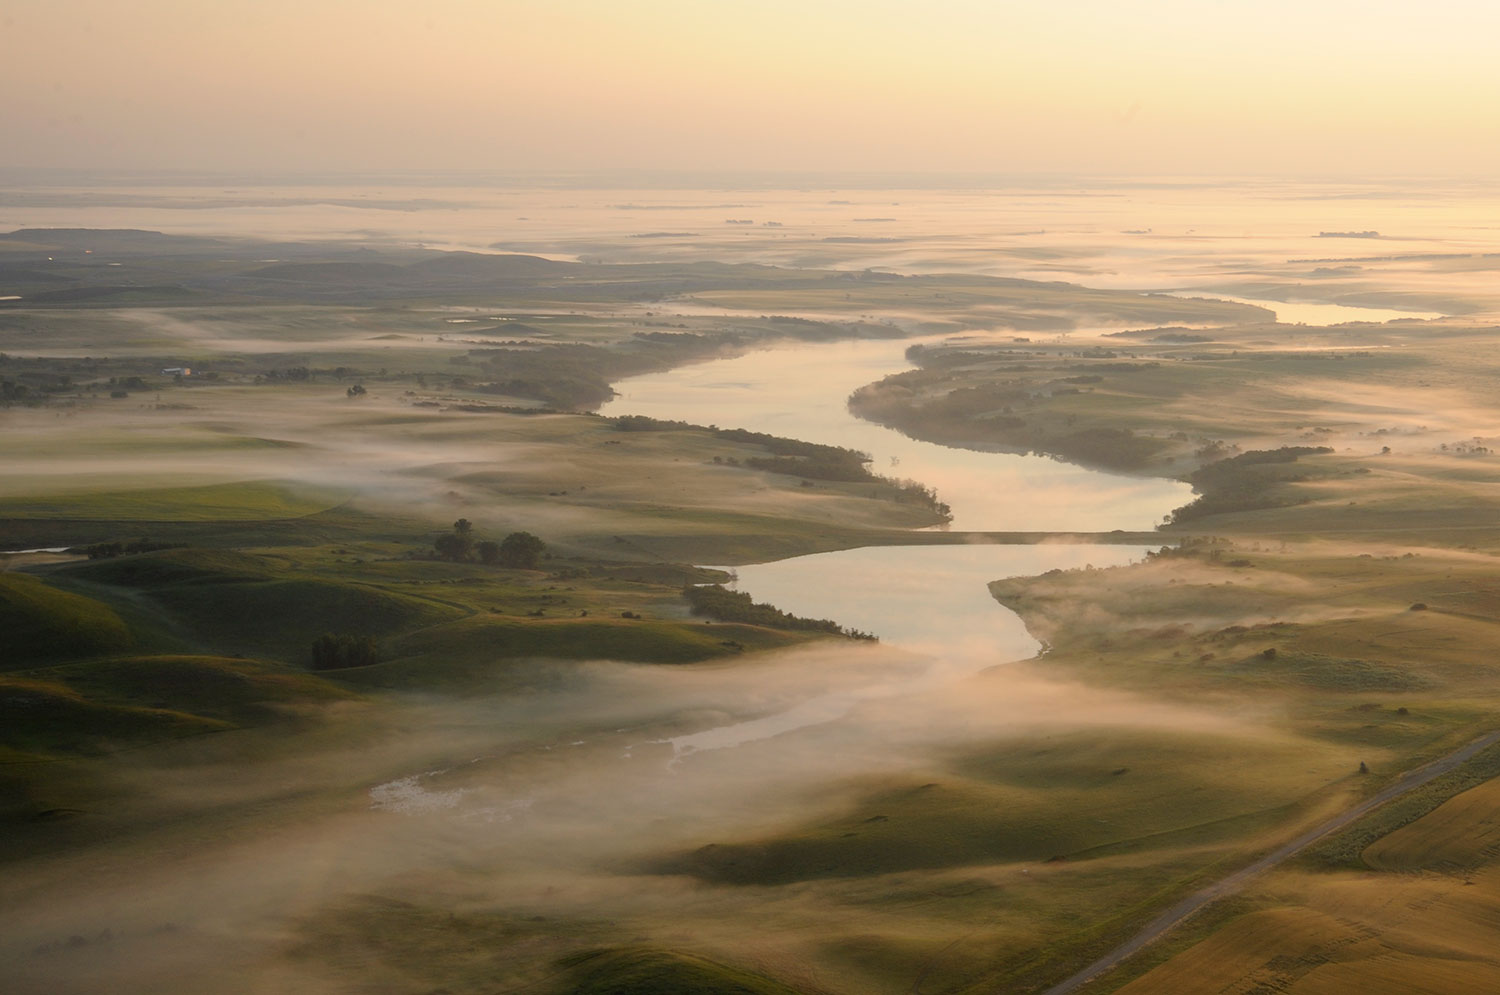
The May Survey became operational in 1955 and the area covered by this long-standing survey is commonly referred to as the "traditional" area, which covers 1.3 million square miles in Canada, Alaska, North Dakota, South Dakota, and Montana. The Eastern Survey Area became fully operational in 1996 and covers and additional 0.7 million sq. mi in eastern Canada.
Methods
- The May Survey is conducted by two highly trained biologists, one of which is also the pilot
- Each observer is responsible for counting waterfowl and ponds on their respective sides of the plane
- Flight altitude is generally between 100-150 feet and speeds are held between 90-105 mph
- Each bird or pond observation is recorded directly into a computer file via a microphone and the corresponding location from the GPS is automatically recorded
Data collected along each established flight path or transect consists of:
- The number of pairs, single ducks, and ducks in flocks for each species
- The number of "ponds" or wetlands with water
These data allow the calculation of an annual index to the number of ducks for each species in the breeding population and are ultimately used by manager in the Central Flyway to monitor populations and determine hunting seasons.
More information regarding the May survey can be found by visiting the USFWS website.
Further information and results of the May Survey can be found in the Waterfowl Population Status Report.
Mid-Winter Waterfowl Survey
The Mid-winter Survey (MWS) was first conducted in 1935 and is the oldest large-scale population survey of migratory birds that is conducted in North America.
Survey details
- All Central Flyway states participate in the MWS
- Conducted primarily by fixed-wing aircraft, but some areas are surveyed by automobile or boat
- Exact means of coverage may vary from year to year; however, the objective is to obtain a complete count of all waterfowl in the survey unit
- Conducted during the first week of January when waterfowl are highly concentrated in wintering areas
- Provides an annual index for all species counted
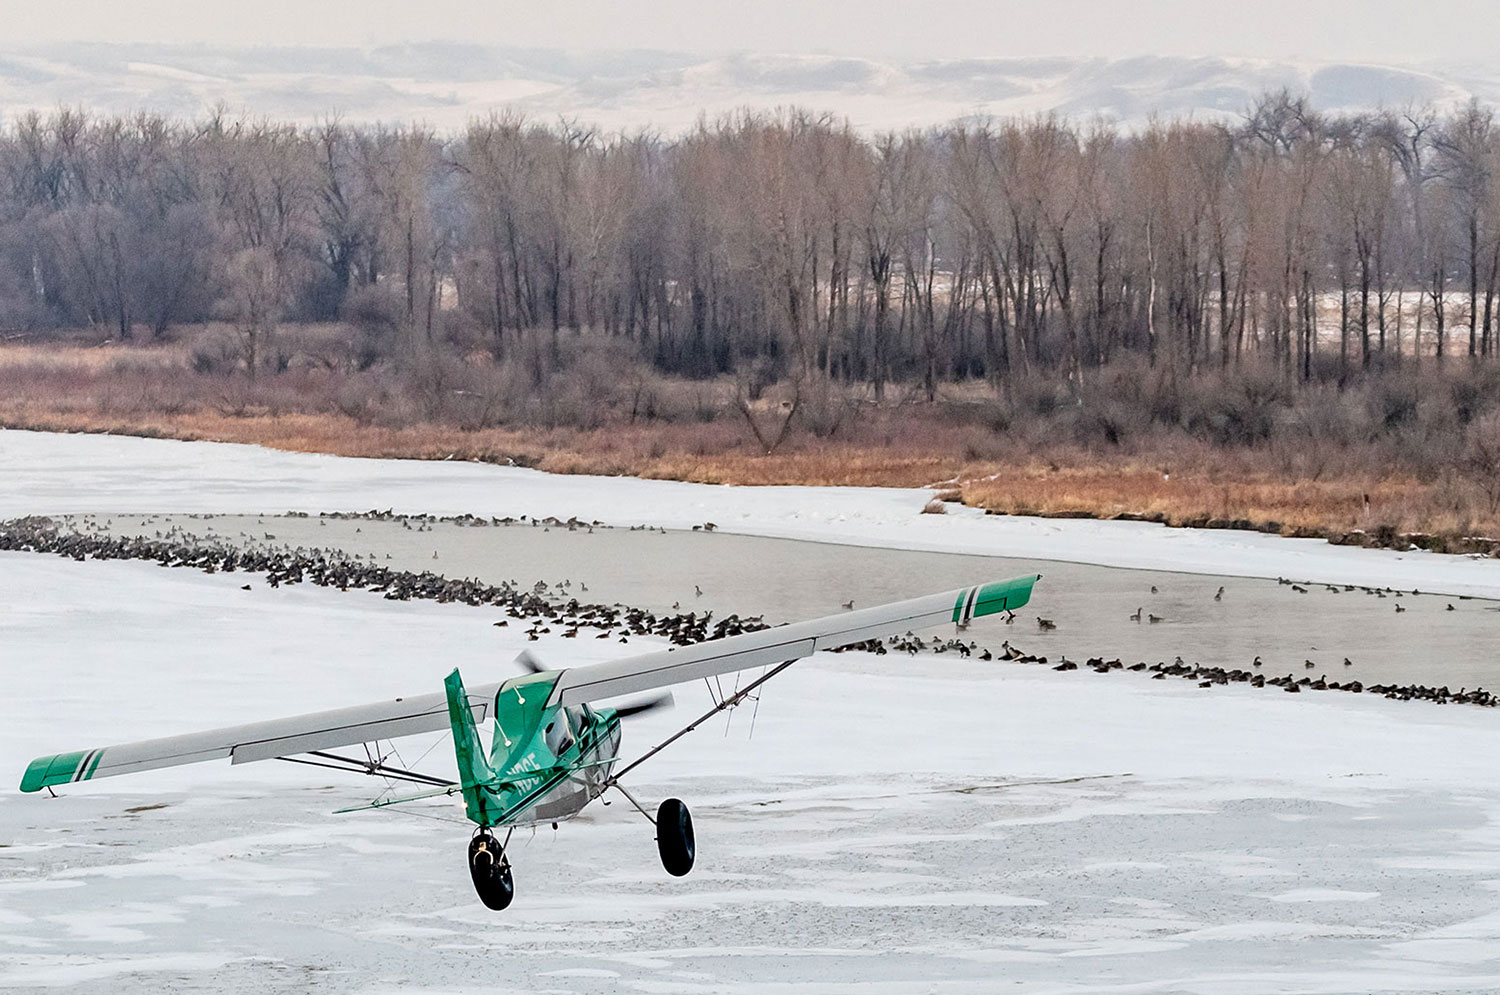
The MWS is perhaps most important for monitoring species that breed in arctic areas not covered by the Waterfowl Breeding Population and Habitat Survey. For these species, such as brant and tundra swans, the MWS is the only status information currently available during the entire annual cycle. As a result, actions included in the management plans for these arctic nesting species are driven by counts from the MWS.
Along with providing population information for some species, changes in wintering distributions have also been detected by the MWS, which helps mangers better understand the resources needed for wintering waterfowl in particular areas.
MWS survey data for all Flyways is available from the USFWS.
Geese
A variety of surveys are conducted each year on breeding, staging, and wintering areas to assess status and trends of goose populations. Surveys are conducted by a broad range of Canadian and U.S. Federal and provincial/state agencies and partners.
Many of these surveys are funded or conducted by the following agencies:
- The Arctic Goose Joint Venture
- The Division of Migratory Bird management Alaska Region (Region 7)
- Canadian Wildlife Service, Environment and Climate Change Canada
- State agencies and partners in coordination with the Flyways
Greater White-Fronted Goose Survey – Mid-Continent Population
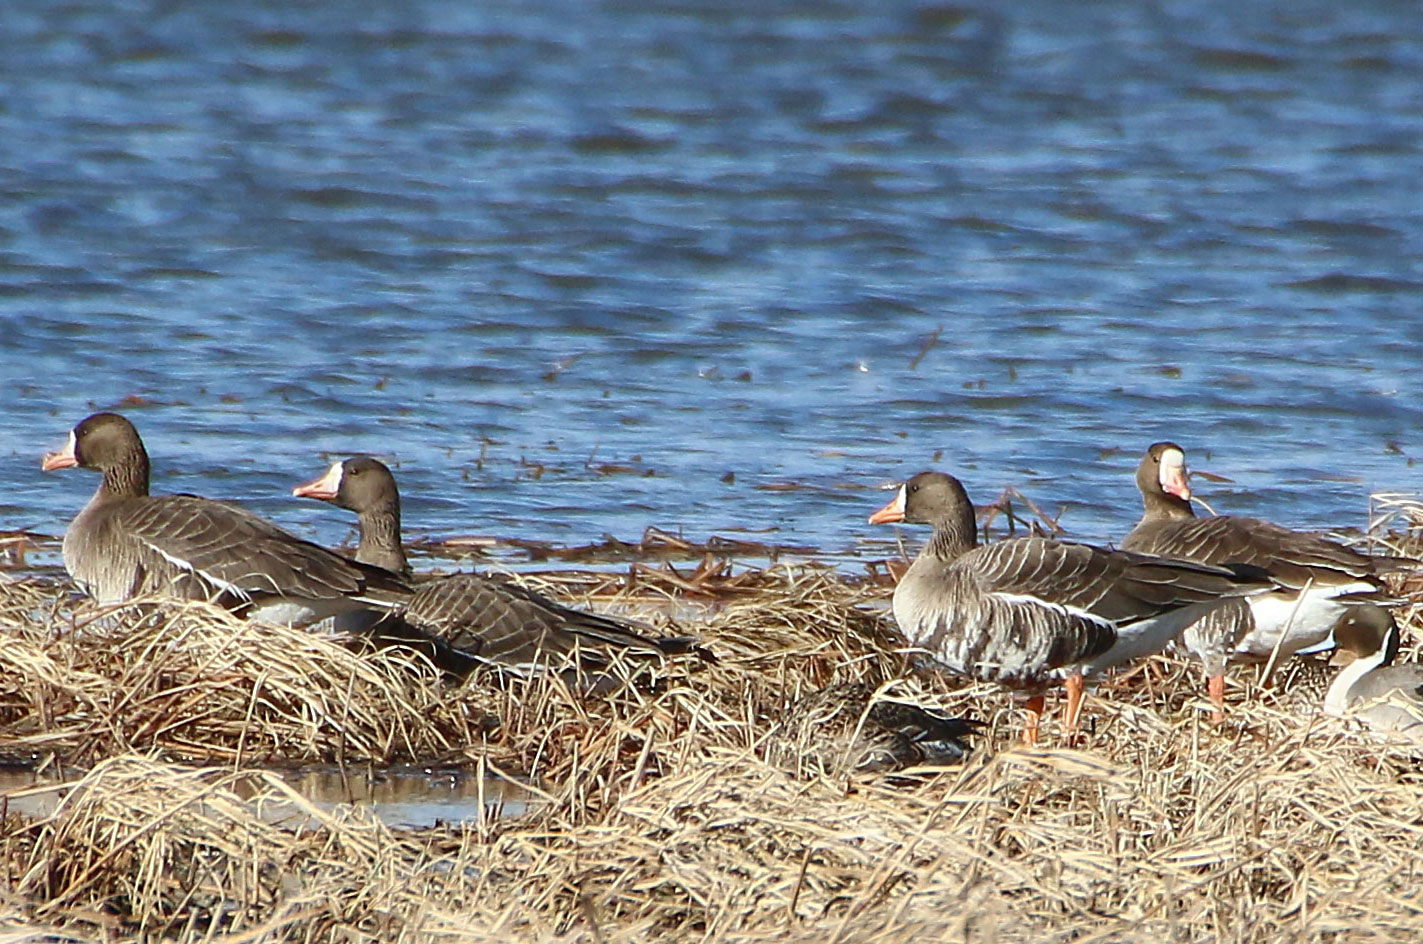
White-fronted geese are difficult to survey on their extensive arctic breeding range in northern Canada. Their winter range has also expanded over the past decade, particularly it has moved north into Kansas and Illinois, but thousands can still be found in traditional wintering areas of Texas and Louisiana.
Justification for the survey:
- White-fronted geese remain highly prized by hunters
- Potentially more vulnerable to harvest pressure than other goose species
- Obtaining an annual index of the population size is very important for population monitoring
The original survey for white-fronted geese was conducted from 1958 - 1995 during spring migration in the Rainwater Basin (RWB) of Nebraska. It was estimated that greater than 90% of the population was being counted in RWB during this time. However, by the early 1990’s, the spring survey in Nebraska became confounded by an enormous increase in the number of light geese (snow and Ross's) also staging in the RWB.
Formal experimental counts were conducted between 1992 and 1994 in south-western Saskatchewan and south-eastern Alberta, where most white-fronts staged in the fall. Since then an operational survey has been conducted in this area every year to produce an annual index to the population size.
Current survey details (Alberta – Saskatchewan)
- Within survey blocks, numbered wetlands are surveyed each year when they have water, and total numbers of white-fronted geese are tallied
- The survey route varies little from year to year, since the same wetlands are visited annually, but it can change slightly depending on wetland conditions
- Conducted in early October, it takes about 7 to 10 days to complete
Further information and results of the mid-continent white-fronted goose survey can be found in the Waterfowl Population Status Report.
Mourning Doves
Details of the former Call Count Survey (CCS)
- Established in the late 1940’s in southeastern U.S.
- Doves heard and seen were counted at one-mile intervals on standardized 20 mile-long routes
- Expanded to the entire lower 48 states in 1953, but routes were chosen based on the presence of high numbers of doves
- By 1966 randomized routes were chosen that provided a better index to the population size
- Between 1,000 and 1,100 routes were run annually in the U.S. from 1966 – 2013
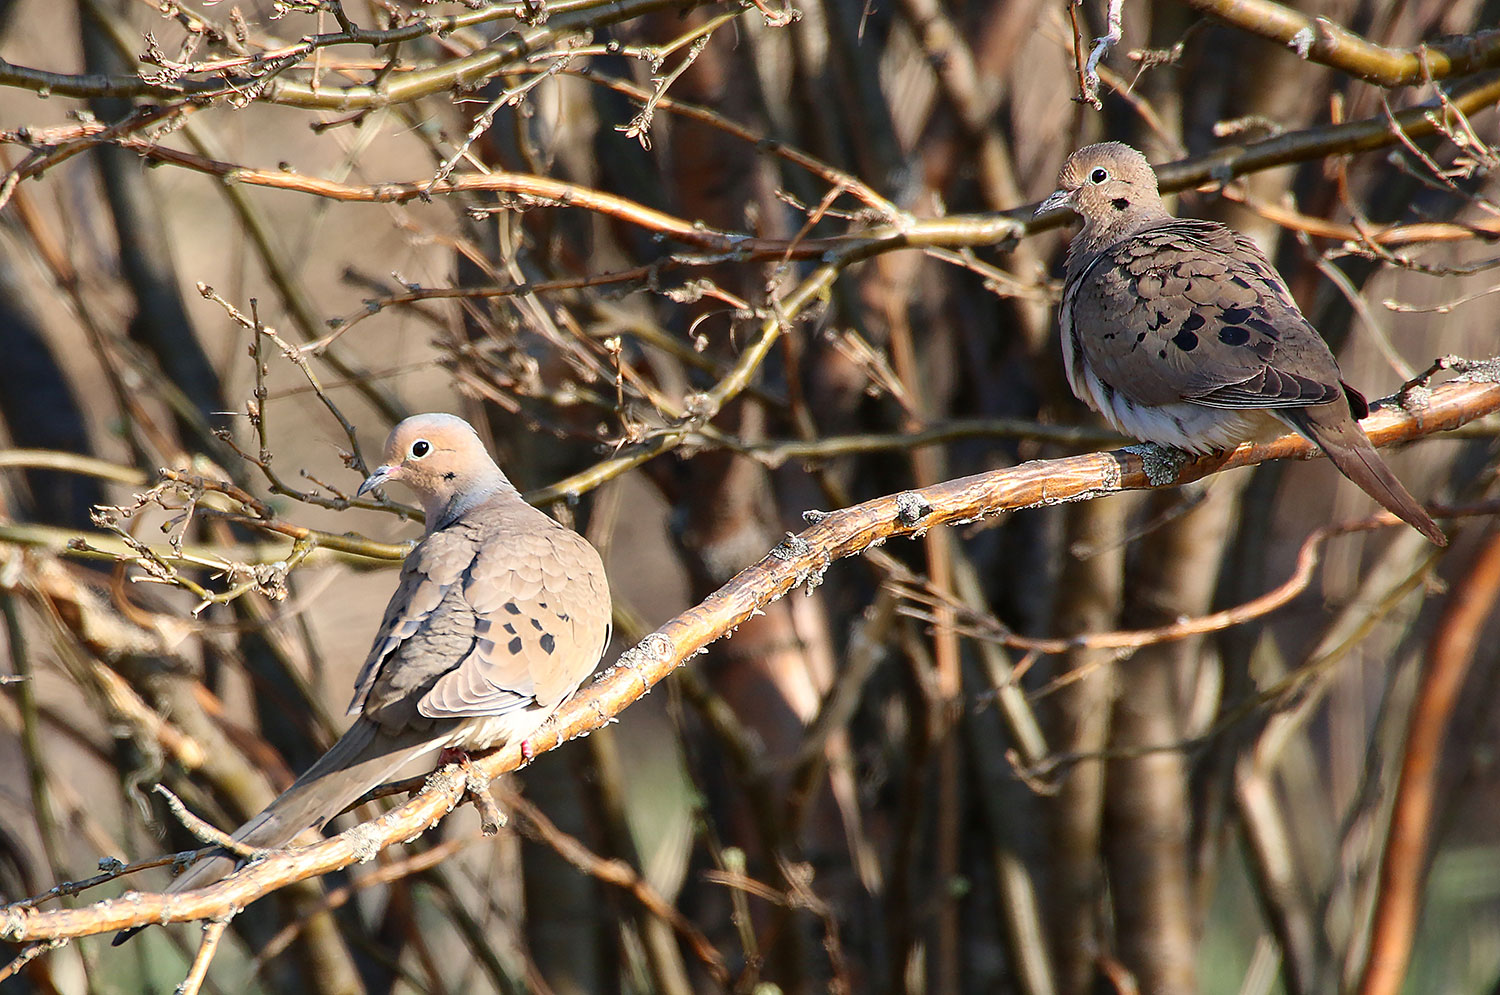
However, the CCS only provided an index to population size, but an estimate of absolute abundance could not be derived. As a result, the call-count survey was discontinued after 2013 and is no longer part of the harvest management strategy for mourning doves.
Current strategy
In 2005 the Mourning Dove National Strategic Harvest Management Plan called for the development of harvest management strategies that included decision criteria that explicitly state when regulatory changes will be made. As a result, a monitoring program was developed in which abundance estimates for mourning doves could be calculated.
Mourning dove banding and harvest strategy
- The current harvest strategy relies on estimates of absolute abundance calculated from band-recovery and harvest data
- A population model is used to predict harvest and resulting subsequent year abundance
- The strategy also provides mourning dove abundance thresholds for each management unit at which restrictive and closed seasons would be implemented
Management Units
There are three large management units; Eastern, Central, and Western, which were first described in the mid 1950’s as containing discrete populations of mourning doves (see map). The Central Management Unit (CMU) includes the 10 states of the Central Flyway plus four states in the Mississippi Flyway (Minnesota, Iowa, Missouri and Arkansas). The CMU has the highest population index of the three large Management Units.
More information regarding mourning dove surveys and population estimates can be found in the status report.
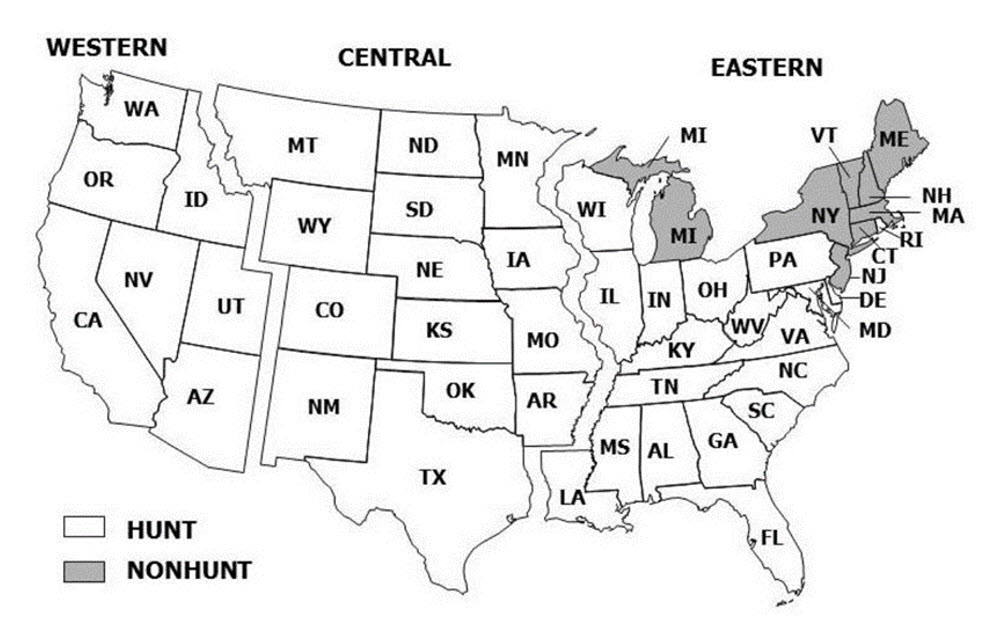
Figure. Mourning dove management units with hunting and non-hunting states (figure from Mourning Dove Population Status, USFWS).
Sandhill Cranes
There are two populations of sandhill cranes that reside in the Central Flyway: the Mid-continent (MCP) and the Rocky Mountain (RMP) population. Surveys for these two populations occur in distinct areas and at different times of the year.
RMP Cranes
Historically surveyed during spring migration in the San Luis Valley (SLV) of Colorado. However, by the mid-1990’s a growing number of MCP lesser sandhill cranes were also using the SLV, confounding efforts to estimate the population size of RMP cranes. The spring survey was abandoned in 1997 and was replaced with a September pre-migration survey in the summer range states.
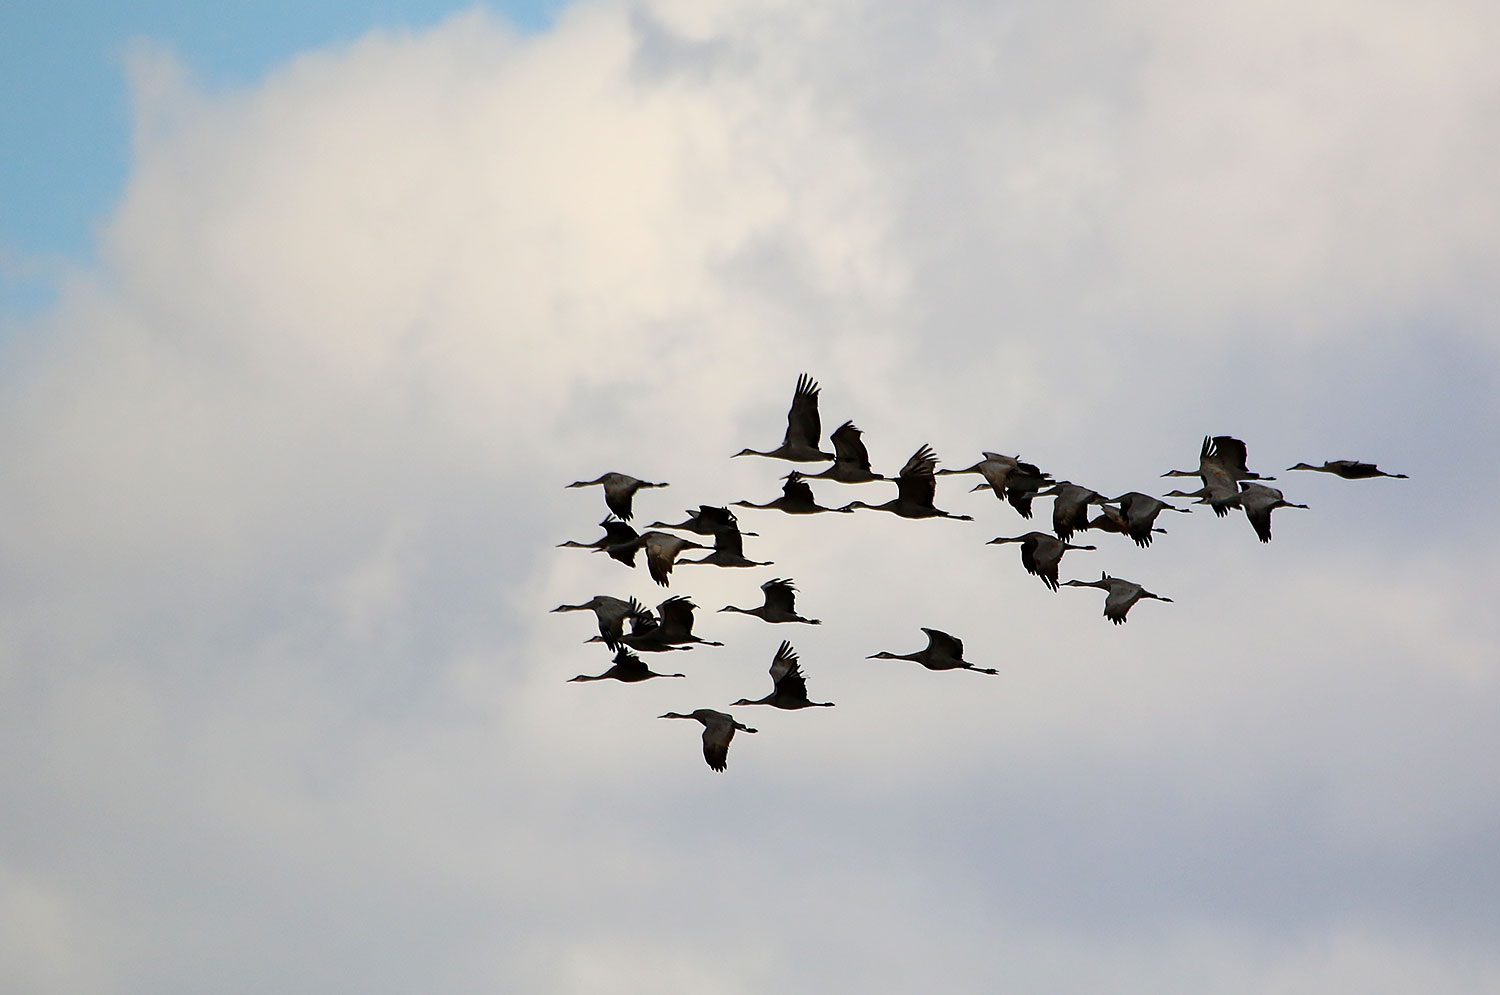
Survey details
- Occurs in parts of Utah, Colorado, Idaho, Wyoming and Montana
- Conducted by air and ground crews
- Takes place annually from September 5-25
- Continues to form a solid basis to derive population indices for management decisions and harvest strategies
MCP Cranes
The sandhill cranes of the MCP are counted during spring migration when a majority gather along the Platte River Valley in Nebraska.
Survey details
- Consists of aerial transects along the Platte River, which are completed within one day in late-March every year (see map)
- Simultaneous ground counts are also conducted on the same day in the states of Texas, Oklahoma, Kansas, Nebraska, and Wyoming
- The aerial portion of the survey is corrected for observer bias at a later date
- If at least 90% of the cranes counted are in the corrected aerial transect portion when compared to the ground counts, that survey is considered reliable for the year
- Has been conducted since 1974 and photographs have been used to correct human bias since 1982
New techniques, such as using infra-red cameras to detect night time roosting cranes on the river are currently being tested to potentially improve estimates of the population size in the future.
More information regarding Central Flyway crane surveys and population estimates can be found in the status reports for sandhill cranes.
Harvest surveys
Sandhill crane harvest is estimated differently than for other migratory birds, which are derived from the Harvest Information Programs (HIP). All crane hunters need to have a special crane hunting permit issued by individual states. The database of crane hunters provides the sampling frame for the harvest survey conducted by the USFWS. In recent years, about 10,000 MCP crane hunters have been sent surveys regarding their harvest and hunting activity. The current harvest estimation system for sandhill cranes has been in place since 1975.
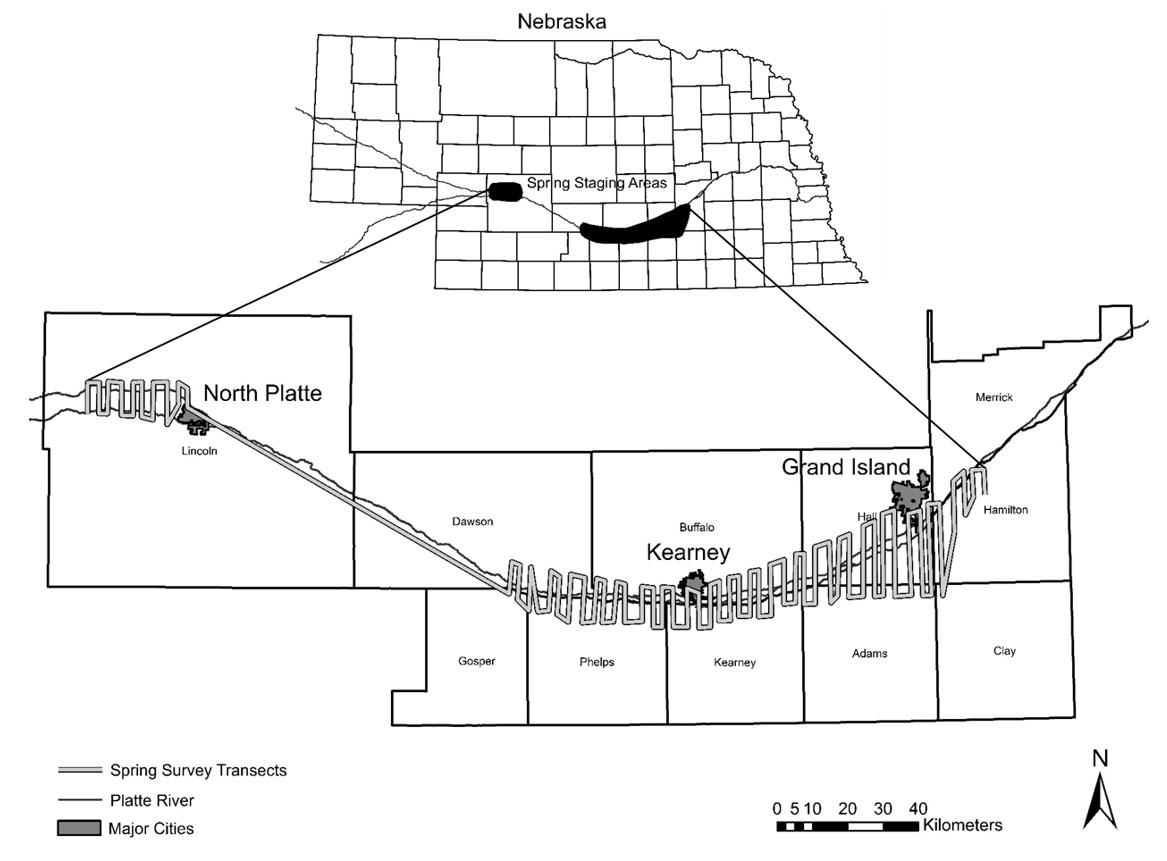
Figure. Spring staging areas and coinciding ocular transects used for the annual spring survey of the mid-continent population of sandhill cranes in the Platte River Valley of Nebraska.
Nongame Birds
There are hundreds of nongame birds in the Central Flyway and monitoring the population and trends of all these species is a monumental task. The North American Breeding Bird Survey (BBS) provides long-term population trend analyses for nongame species and their population status. The Christmas Bird Count (CBC) is another tool that provides information on trends for wintering birds. The BBS started in 1966 and the CBC began in 1900. More recently, an effort to identify density and occupancy estimates of bird species among geographic areas and across spatial scales was initiated by the Bird Conservancy of the Rockies through the Integrated Monitoring in Bird Conservation Regions (IMBCR) program. Individual state and provinces of the Central Flyway conduct independent nongame bird surveys and monitoring as well, but communicate and collaborate through the Nongame Migratory Bird Technical Committee.
Online Resources
- North American Breeding Bird Survey
- Christmas Bird Count
- Bird Conservancy of the Rockies IMBCR
- Partners in Flight
- North American Bird Conservation Initiative - United States, Canada
